
Vibe Coding a Machine Learning Model on NFL Data to Beat My Friends
Introducing (Degen)tic AI: how tools like Claude Code have turned my interest in sports betting into a lesson in statistics

A Brief Backstory
If you’re like me, the start of the NFL season brings an unexplainable excitement. And if you’re like me, you’ve also overcommitted to a small army of fantasy leagues and fired off more parlays than you’d care to admit.
My friends and I kick off every season with a handful of competitions. We snake-draft all 32 NFL teams - best total record wins. We’ve got the standard PPR fantasy league, a weekly Thursday-night six-leg parlay (haven’t won one yet), and about a thousand smaller side bets sprinkled in between. But the crown jewel of it all is our weekly team pick’em: every game, every week, against the spread. We’ve been running it for five years now, and the results are below.
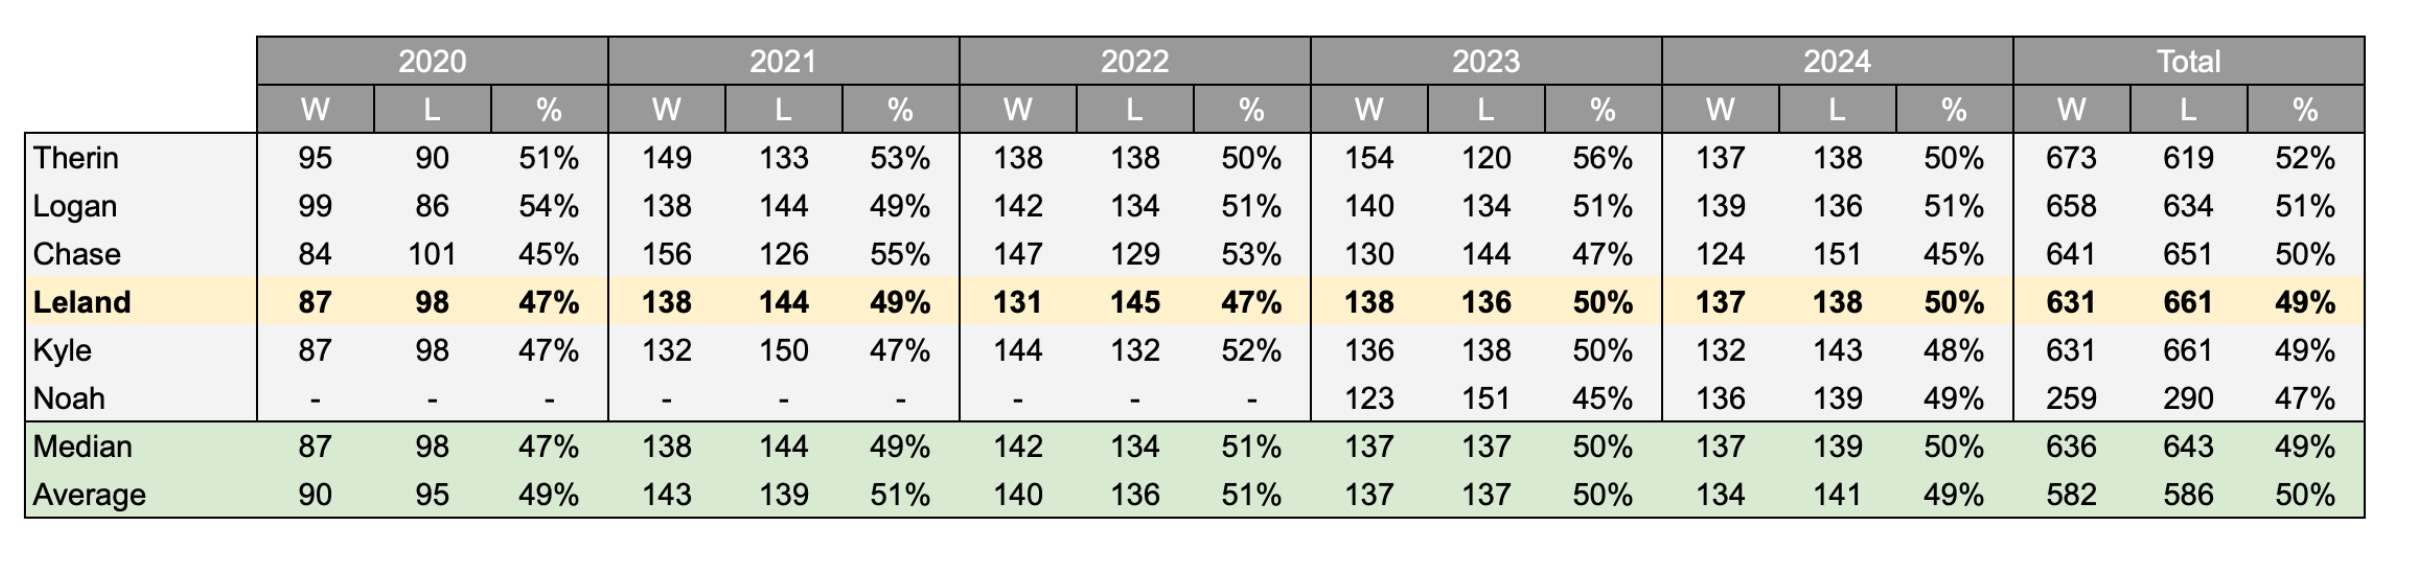
I’m sure you can see the problem - I am less accurate than a coin toss when selecting teams each week.
Around the same time I was facing another dilemma: I desperately wanted to build something, but didn’t know where to start. Being in an industry that invests in AI, every day is a reminder that we are moving at breakneck speed and that copilots (think: AI coding) are at the very center of that innovation. Watching LLMs write code feels like rediscovering that first “holy shit” moment I had when I started to learn Excel. They are the single best use case for AI right now, the only use cases that are currently being proven out in the Enterprise, and might also have the highest ceiling. With AI and a little persistence, every person with internet access is an engineer - I don’t think most people realize how big of a deal that is.
What tipped the scales was realizing I could query massive amounts of NFL game data for cheap (more on that below). So there it was, the perfect recipe for a project: a personal interest in the subject, data to provide a moat, and the means to get it done: Claude MF’in Code.
The Data Dilemma
Far and away the biggest challenge of this project was working with the API for the NFL game data. Usual sports data from a reputable place like SportsDataIO can be thousands of dollars, so I elected to use RapidAPI which offers a pretty comprehensive chunk of NFL data for a lean $9/month. With rate limit of 200 requests/minute and 10,000 requests/day, this would provide me with more than enough flexibility to get started.
That was about the beginning and the end of the easy decisions. Once I got to exploring the API endpoints and documentation, I realized the challenge ahead. Patchy or outright missing data, differences in JSON format from year to year, and massive amounts of unneeded data making payloads almost impossibly large to work with were a few of the biggest issues rearing their unstructured heads during the phase I thought would be one of the easiest. Troubleshooting all this in ChatGPT alone turned what I thought would take a few days into weeks.
My day consisted of querying an endpoint for a single game, pasting the payload into ChatGPT, and slowly creating python scripts to pull data, transform and load into MongoDB for further use. This worked to an extent but was a massive time-suck and though Codex is improving, its lack of context not being connected to a real IDE made all the downstream issues harder and harder to fix.
Enter: Claude Code.
I had only really heard of it at this point. Tons of hype online from people I respect. Tons of hyperboles and ‘game changer’ talk from the worst tech influencers I know. I do know that ever time ChatGPT spun its wheels while I tried trouble shooting code and couldn’t do what I asked, I’d pop over to the Claude portal and it would generally figure out the issue in 1-2 prompts before rate limiting me a few minutes later. But I was desperate and $100 a month didn’t seem like a huge price to pay if it could save me some time.
Besides opening Jupyter and a few pip installs, I had never coded in the command line (CLI) before so I also downloaded Cursor. It took me a week of using Cursor to realize I was paying via API credits and leaving a whole bunch of credits on the table that come with my ‘Max’ plan simply because the CLI freaked me out. But I am cheaper than I am fearful - so I learned something new. To be fair, it was as easy as typing in ‘claude’ in the folder I wanted files edited in.
But no matter how I used it, the point is that Claude Code is unreal. The product was truly agentic, a term that is thrown around today despite it being almost always erroneous (most of these ‘agentic solutions’ feel a lot like Amazon’s ‘Just Walk Out’ fiasco). The agent understood my process flow, had access to my MongoDB table schema, and was even able to query different endpoints and analyze JSON returns, all while maintaining context awareness. I went from spending hours troubleshooting a single python script to minutes, completing them with just a few prompts.
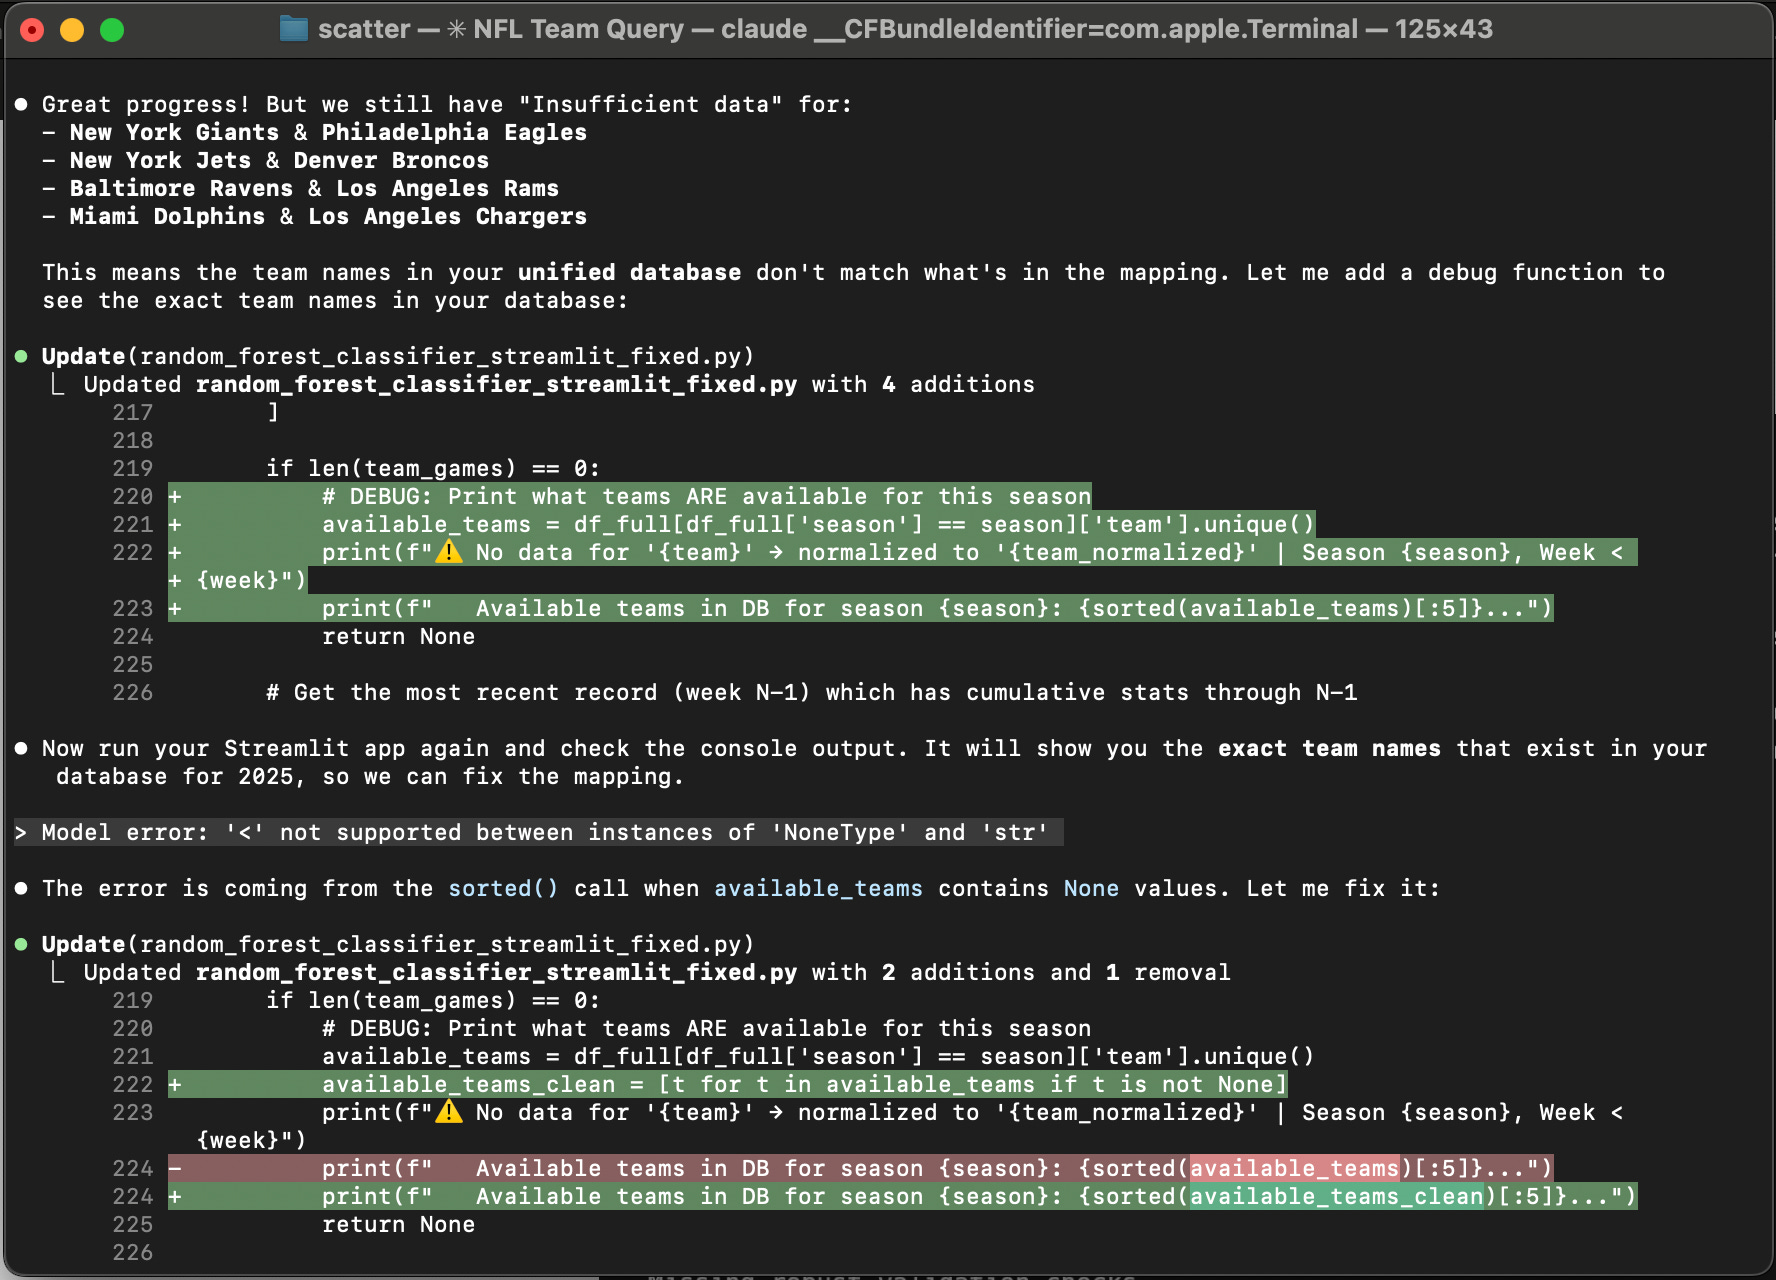
Claude will add and delete files as it sees fit. It will install libraries and test to make sure they are correctly installed and in the right place. As it edits a file you will see +200 lines to the file, -100 lines deleted. All this is done, of course, with the user approving each new edit - a feature you can turn off entirely to let Claude take control. As someone who barely rejected an edit, I don’t see why you wouldn’t let it run the show. Finally it felt like we were making progress.
Regression Ramp
After what felt like a millennia of running my code, checking Mongo, reprompting and repeating, I had a shiny new dataset that was ready for a much more interesting step. I realized what I wanted out of this project was to learn more about running regressions - could I find a game metric (or series of metrics) that correlates to a team’s likelihood of covering (beating the spread).
Immediately it made the most sense to aggregate all game metrics for a team as they go through the season, averaging those figures out by game - this meant week by week, the numbers should become more accurate or closer to the teams true skill level. As the n-size grows, any large aberrations would normalize and the regression model should be working off as close to what ‘normal’ looks like for a team as possible.
I pulled 10+ offensive metrics (score, first downs passing/rushing/total, yards per play passing/rushing/total, completion %, possession time, 3rd down conversion %, red zone conversion %, etc.) and almost 10 defensive metrics (opponent score, yards given up, turnovers forced, 3rd down stops, sacks, etc.) for a period of about 10 years. I held out 2 years for backtesting, and started the regression on the other 8. I had my guesses, but wanted to see as a whole, which metrics correlated more often to a cover than others. I ran a really simple linear regression to see what I could glean initially and which metrics to focus on.
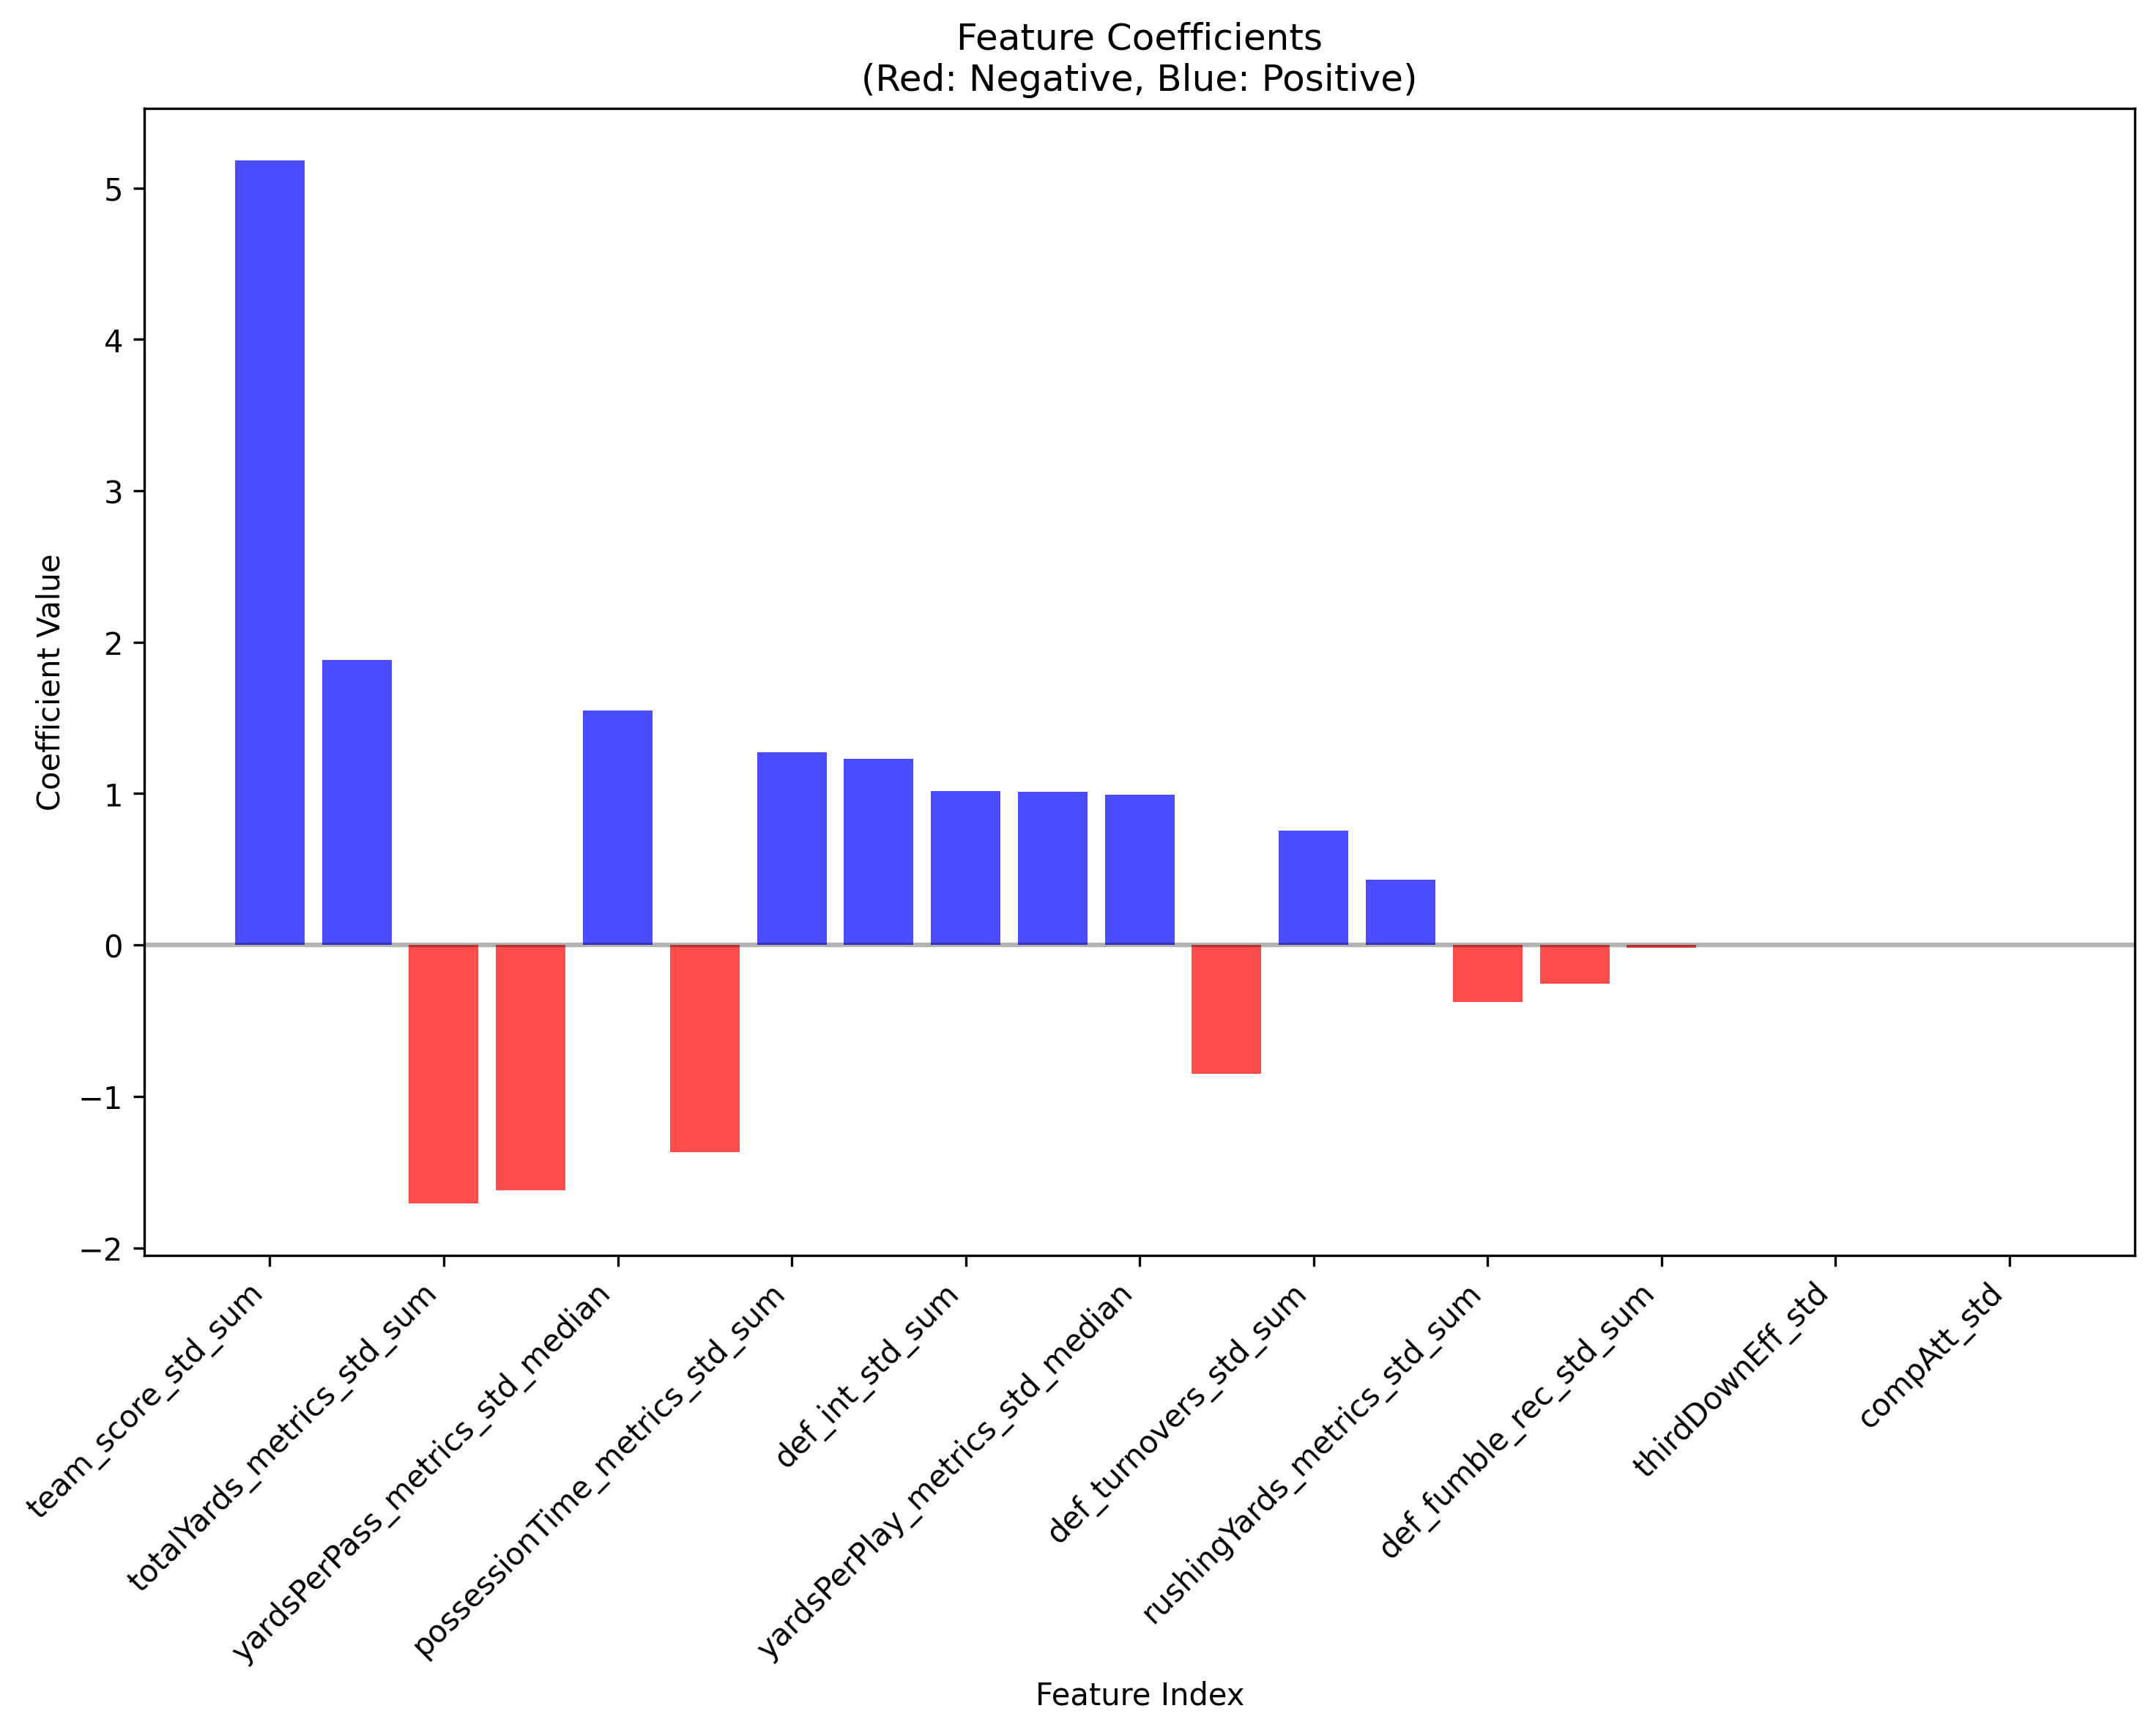
Wouldn’t you know it, teams that score more points tend to cover. What was shocking were some of the negative correlated metrics - total yards, yards per pass, possession time. This was unexpected.
I wanted a place to ask questions about my methodology, what things mean, how I can refine my thinking on the model weights and construction. And as much shit as I talked about ChatGPT above, it was the perfect place. I uploaded the above photo to a new chat and asked its perspective. It flagged systemic issues like multicollinearity and overfitting - things I had barely heard of let alone thought to account for in the model.
Thus began a crucial part of the workflow: I needed a sounding board to understand key concepts and if I was taking the right approach. I couldn’t waste credits asking Claude, and ChatGPT was the perfect partner. I could run a regression and ask Claude for model evaluation/weighting outputs, plug into ChatGPT, refine the approach, and re-prompt Claude. Was it a little cumbersome? Definitely. Did it work? Absolutely. One note: I probably could have done this semi-natively in Claude by switching to much cheaper models for questions and expensive ones for the coding, but I had a lot of questions and was still worried about burning credits.
From here, I ran regression after regression. I switched to a ridge regression to address the multicollinearity. I weighed recent seasons and later games more heavily. R² = 0.234, still needed some work.
I was constantly pasting in the model results to ChatGPT, asking follow up questions about every little thing it noticed. Finally, a suggestion came through that made so much sense:
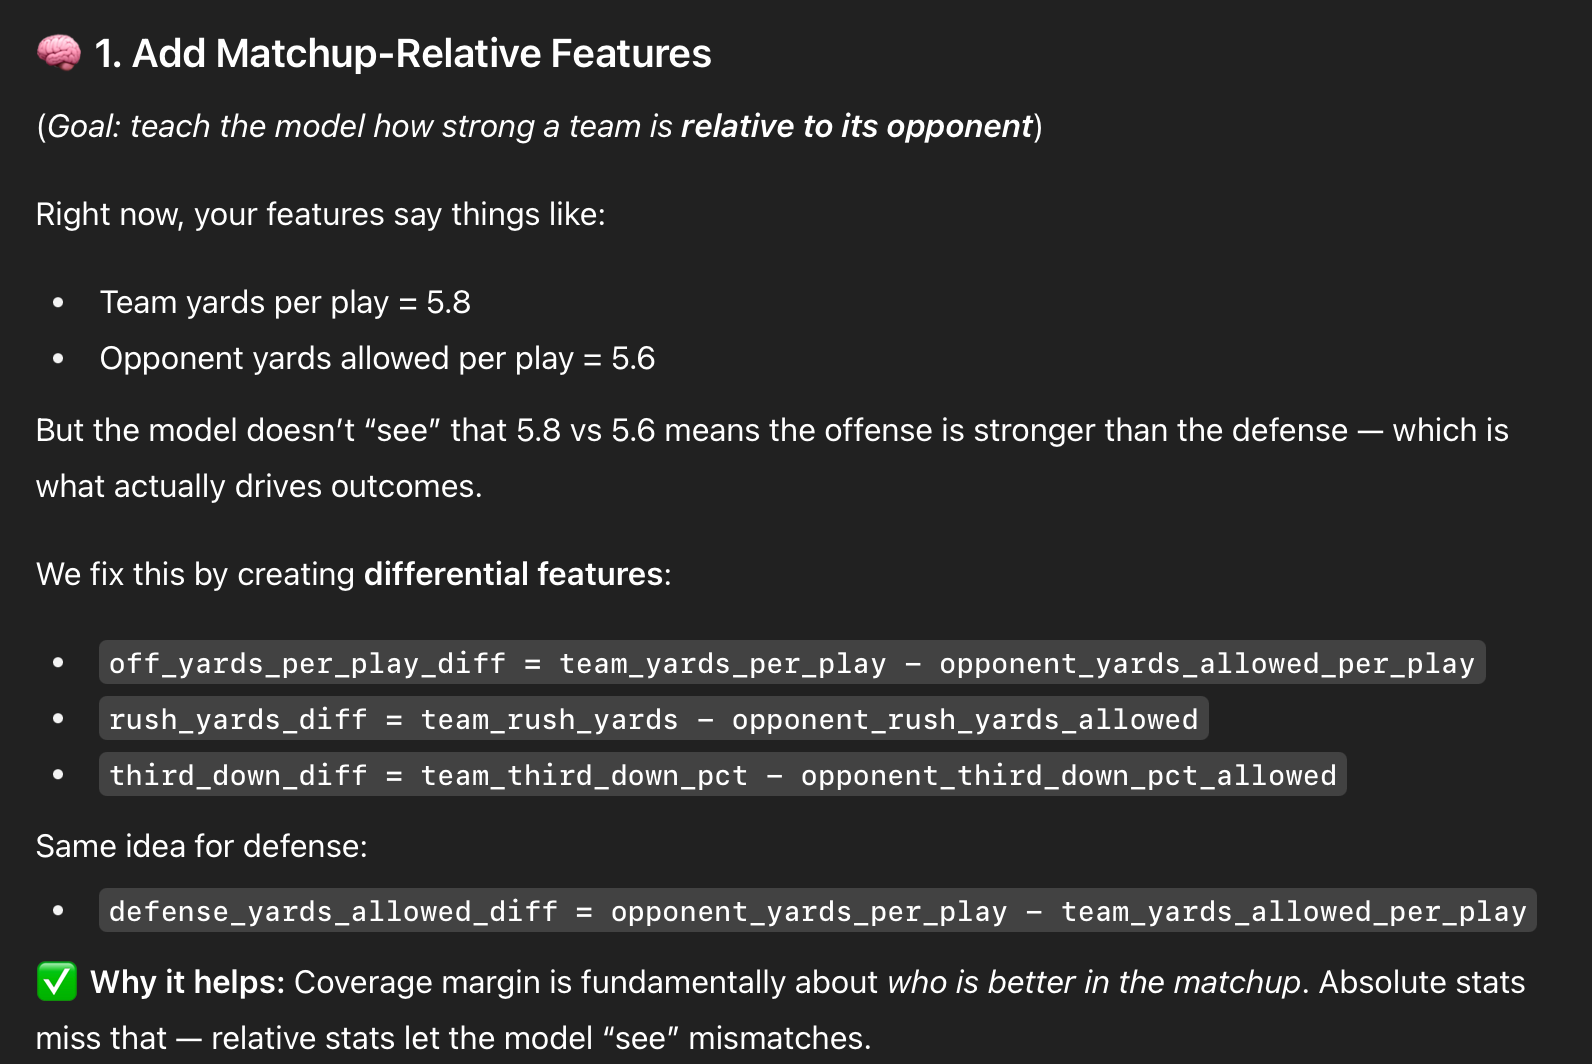
I was fitting the models with isolated team stats to try and see if there would be correlation to a cover, completely ignoring the opponent. Chat suggested using differentials to better capture the context of the matchup, not just each team independently.
I also relented to a suggestion that ChatGPT had been pushing for a while: switch from a linear regression to a Random Forest or XGBoost machine learning classification model. The reason was that I was assuming there was a linear correlation between metrics and covering the spread, but the reality is that there is much more of a tangled relationship. Random Forest would allow me to average the results of hundreds of decision trees, finding patterns that were not as obvious. I would switch from coverage margin (how much a team is covering by) as the target in the regression model to a binary target classification model: would a team cover (y/n) to add even more simplicity.
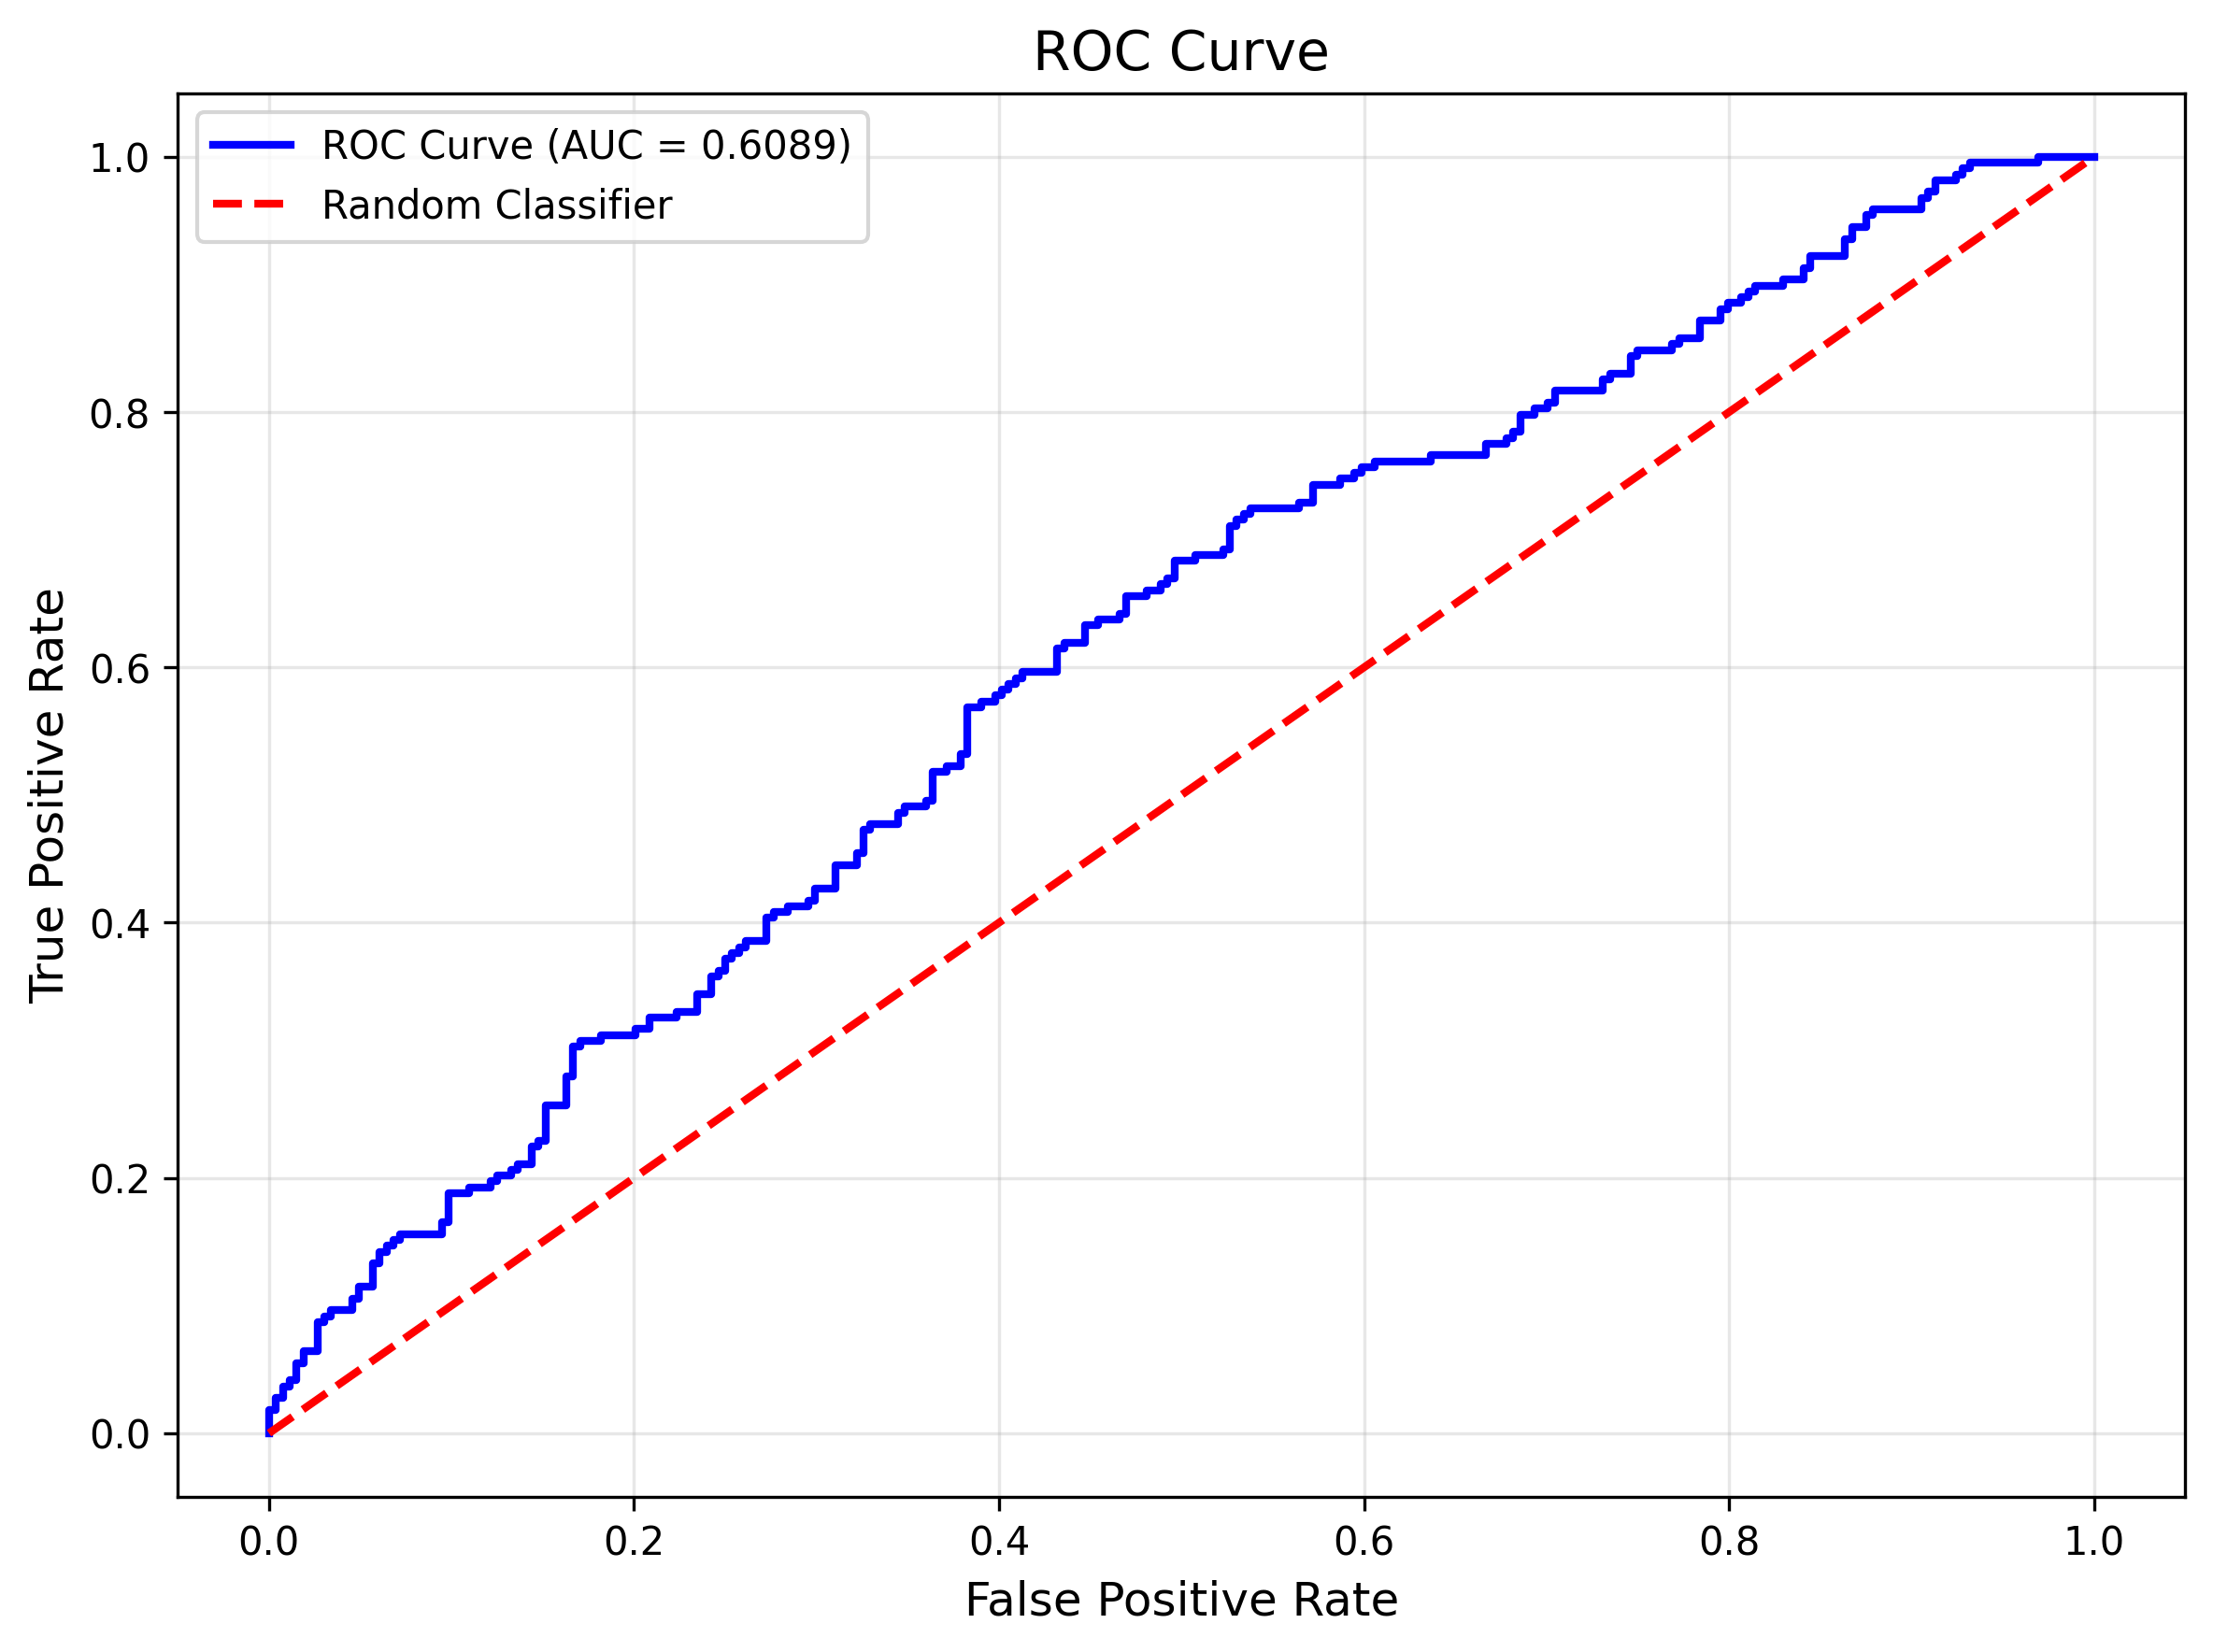
Boom. So simple, so effective. I would use ROC-AUC (Area Under the ROC Curve) as my key evaluation metric along with the gap between my training and test accuracy to make sure overfitting (memorizing the test data) was low. My AUC for the model was 0.61. If we assume a random guesser or coin flip yields you an AUC of 0.5, I am seeing almost 22% better cover predictions of the test data. Additionally, the gap between my training and test accuracy dropped to 10% from a massive 39% for the model in a previous turn. This was done primarily through toggling things like depth, sample splits, and more (all suggested by ChatGPT and executed by Claude).
Learnings
By the time I had gotten this model into production, re-running (and hopefully improving) each week with the introduction of new game data, my head was spinning. I did learn more in this 2-3 month stretch than I have in quite a while and wanted to distill some of the key learnings on the off chance it helps anyone else.
You can’t know nothing - you have to have a very basic knowledge of how to install things, move around in the CLI, query an API and use and protect an API key. Luckily, learning this is incredibly easy if you dedicate the time.
That being said, I didn’t know a damn thing about regressions. I learned it all as I went with the help of ChatGPT (I don’t know how many times I typed “simplify this concept”). It is possible to learn this stuff at any age if you use AI to help you!
If you only want to use Claude Code as your copilot to make things simple, you don’t need Cursor, just use the CLI. Cursor is great for using multiple models from different providers and has a familiar experience to VSCode with more AI-native capabilities, but I found it more of a nice-to-have.
ChatGPT is absolutely needed for ideating but not coding. Without it, I’m not sure if my model would have improved much. It’s SOA vision model read my model results with ease and its suggestions were always spot on. It explained concepts to me clearly and become a life savor in other ways after I had written its Codex capabilities off (which I stand by).
The only AI in this project was from a Copilot. That was by design. I still don’t trust AI web search or general LLM returns in projects that require high fidelity outputs due to hallucinations that we still see every single day. I preferred to use real data and close off the project to any risks associated with other AI features. I think this is the case currently in the Enterprise and will continue to be the case for some time.
My use case wasn’t a perfect one. The spread adjusts for a team week to week which makes prediction next to impossible if you assume they are pricing in all the things you think you are catching. But it was fun and I wouldn’t change a thing.
Stay Tuned
Finally, I’ll be posting the results of this model within the next few weeks or so. I picked the first 5 weeks myself and will have the model pick the rest of the season, so I should be able to have a pretty good control group to get a picture of improvements. Stay tuned! Also, check out the v1 of the Streamlit app I put together with the model results in the video below.
Github: https://github.com/lelandjfs/nfl-app-2025
How much weighting are you putting towards current season vs prior seasons? I would assume as a season goes on you would add more weighting to the current season?